

You’ve studied and practiced. You have read all the sites and gotten all the tips and tricks from friends and helpful strangers online, but you still can’t seem to improve your writing. If this sounds like you, you aren’t alone. Along with speaking, writing can be one of the most difficult skills in English. You will need to display a wide variety of skills to pass the IELTS writing test with your needed band score. The good news is this isn’t as hard as you might think it is.
With a detailed plan and a lot of practice, you can ace your IELTS writing test and leave the IELTS test behind!
To wow your examiner and smash your writing task 1, you must:
- Read and understand the question.
- Identify the main features of the data.
- Summarize the information presented.
- Present main features.
- Compare and contrast information.
We are going to examine Writing Task 1 in-depth. If you want a quick overview of tips you can use to improve your writing for tasks 1 & 2, I have written about that here.
1. Read and understand the question.
The most important thing you can do for the IELTS writing task 1 is to read and understand the question it is asking you to complete. You will receive valuable information about answering the question if you read it carefully. The graphic you must evaluate will be summarized in the question and you will receive your instructions on how to answer it. Let’s take a look at an example of a writing task 1 question to see what this looks like:
This is an example of a task 1 question type. You can see that the first part of the question is a summary of the graph that will be below. You can use this to great effect when you go to write your answer, but you must take care that you do not copy the summary exactly. You should use your paraphrasing skills to restate the question in your own words.
The second part of the question contains your instructions. This doubles as a sentence that tells you what you need to accomplish and a structure for your writing. The instructions ask you to do three things:
- Summarize the information
- Select and report the main features
- Make comparisons of the features in the graph
The requirements for the questions will be similar across question types, but sometimes they differ slightly so you have to be certain you read and understand the question given to you on the test.
You can see why the summary given to you will be useful. You can use it to understand the information contained in the graphic, and you can refer to it when you write your own summary, which is the first thing the question asks you to do.
Summarize
Writing the summary should be straight forward. You need to look at the graph, chart, or diagram and understand what information is being shown. You then need to translate that knowledge into words explaining the data. The summary in the question is quick; your own summary should give more detail than the one offered provides. You don’t need to write a crazy amount, but you should go into a bit more detail. Talk about dates, time periods, the participants of the study (if relevant), etc.
Main Features
Next, you will need to select and report the main features. This means that you will need to look at the data set and choose which parts should be considered the main features. There will be a lot more information included in the data set than you can possibly write about in 20 minutes. You are provided with more than enough information to answer the question adequately. Notice how the question asks you to talk about the main features of the graph, not all the features. You need to accurately pick these out from the graph you’re given.
Compare & Contrast
After choosing and introducing the main features in writing, you need to compare and contrast them. This will be your opportunity to showcase more advanced grammatical and lexical range. These are two of the categories that directly contribute to your band score (25% each). Ideally, you will pick the features that are the easiest for you to make comparisons with.
Task 1 is primarily concerned with your ability to accurately describe something. You don’t need to worry about including your opinions or personal stories. Your main focus needs to be on answering the question objectively and in as much detail as possible within 20 minutes. The challenge will be understanding the question, organizing the details, and writing about them in an acceptable style.
2. Identify the main features of the data.
We spoke a bit about selecting the main features above. The data set you receive will be either a graph, chart, or diagram. You need to read and understand the information in the chart so you can make decisions about what you will write about. Let’s look at the graph from the question above:
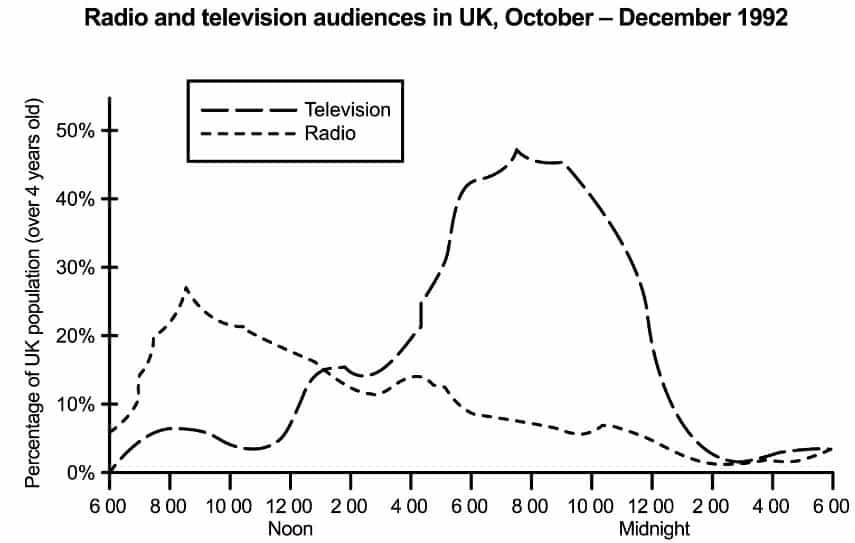
We know from the question above that the graph is showing us the number of people watching TV or listening to the radio at any given time of day. On the x-axis is the time of day. On the y-axis is the number of people (shown as a percentage) who are watching/listening to the TV/radio in the UK.
Which features of the graph above are important? You might want to consider:
- Areas of highs and lows in the data.
- Areas where the data are similar to each other.
- Date the data was collected.
- Who the data is about
These are all good ideas to consider including in your writing. The question gives you some wiggle room in deciding which parts of the data are the main features, but you still need to be able to identify some key elements to talk about.
The highs and lows of the data set are a logical place to start your discussion. Generally, these types of data are easy to compare and contrast with each other and are the easiest parts of the graph to understand. It may be more difficult to write something meaningful about the areas of the chart where they are similar. It depends on what you personally find easiest to write about.
The breadth of the questions in IELTS gives you a lot of room to answer the questions in different ways. You should take advantage of this fact to make the questions easier for yourself. Write about things that are easy for you.
3. Summarize the information presented.
Now that you have read and understood the question and chosen your main features, you can start to write your response. At this point, you should have a solid grasp on the structure your writing will take and the things you will write about. First, you need to summarize the data set. We touched on how this should be done above.
You want to make sure you are not copying the summary offered in the question.
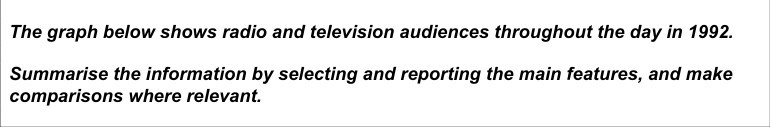
The graph below shows radio and television audiences throughout the day in 1992.
This is the summary provided in the question. It gives a very basic summary of the information in the graph. The question also asks for you to summarize the information too. You want to be able to do this without repeating the same summary from the question. Here is an example of this:
The following graph displays the average percentage of the UK’s population (above the age of four) viewing Television programs or listening to the radio throughout the day in the fourth quarter of 1992.
In this example, you can see how I included all the information given in the graph. The original summary only includes a brief explanation of the data and the year.
4. Present main features.
After writing your summary, your next task is to write about the main features you picked out of the data set. You must mention all the data you will use in the next stage where you make comparisons. This is an introduction to the data you will use then. You should be as detailed as possible while you present these features. You should assume the reader cannot see the graph you are talking about, so you must include all the figures and extra details in your explanation. Let’s take a look at an example:
Starting at 6 in the morning, the graph shows 0% of the UK population is watching television and 8% is listening to the radio. Soon after at 9 am, radio reaches its greatest extent of listeners (around 28% of the population) before trending downwards for the rest of the day. Almost 12 hours later at 8 pm, television reaches its greatest extent of viewers (around 47% of the population).
Radio’s listenership is lowest (around 2%) in the early morning at 2 am while viewership for television is lowest at 6 am.
This is an adequate introduction for the information we selected earlier. Notice how we did not include all of the data we identified earlier; the total word count for the passage up to this point (including the summary written prior) is 120 words. We have almost hit the minimum word cap for the task (150 words) and we still have to write the comparisons. In this case, we don’t need to include more information. If we did, we have it available.
Always plan for more than you need. It’s better to have it and not need it than need it and not have it.
5. Compare and Contrast Information.
The final thing you need to do before completing the question is to compare and contrast the data. Remember to include all of the information you will talk about at this stage in your earlier segment. You shouldn’t talk about new information here. You need to introduce it first.
The main idea here is to showcase your ability to logically structure complex ideas. You want to make use of proper vocabulary and linking words to structure a good final paragraph. Something like this:
While television experiences its lowest average viewership of 0% at 6 am, the same is not true for radio which has an average listenership of 8%. Radio experiences its peak listener percentage early in the morning at around 9 am, whereas television is almost the exact opposite. It experiences its peak viewer percentage in the evening at 8 o’clock. The peak percentages for both forms of media are also different. Television’s audience is almost twice as big as radio (28% compared to 47%).
Altogether this is more than adequate to reach a band score of 9. The final length of the piece is 201 words (a full 51 words more than the minimum). If you write something similar in structure, you should have no problem reaching your needed band score. Just follow the structure given to you in the question.
Other question types
Above, we looked at an example of a graph. This is only one type of writing task 1 question you may encounter during the IELTS writing test. There are other types of graphs, charts, and diagrams that are assigned for test-takers.
Bar Charts
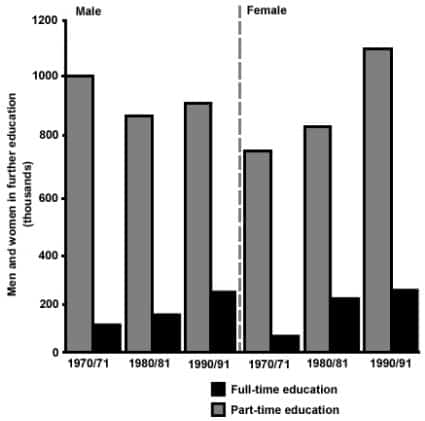
A bar chart is a different kind of data source you might come across. There is more data contained in this particular chart than the one before. It can be intimidating to work with a more dense data set, but you shouldn’t worry. It is actually better if the data set is dense than thin.
Think back to the discussion above. You don’t need to discuss every piece of data in the chart. You only need to discuss the main features. More information in the chart means more information to write about if you need it. The important thing to realize is that you don’t need to write about it all.
Diagrams
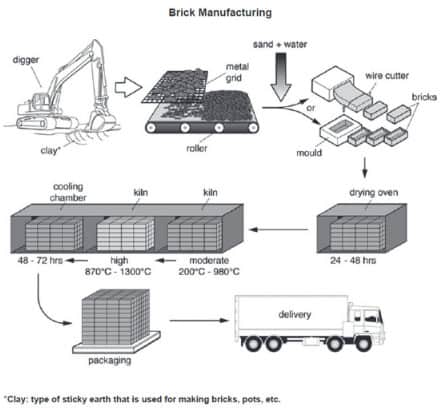
Diagrams will be one of the most difficult question types because of their density. There is a lot of information contained in the diagram above. You need to pick out the most important pieces of information and explain them in detail.
The first thing you need to do when dealing with a diagram is to understand the process being displayed. In this case, the diagram is about brick manufacturing. You should begin by isolating each separate step of the process. You need to understand how to order the ideas before you start to write, so you should carefully examine the diagram to understand the whole process. I see 7 basic steps to the process. How many do you see?
- Extraction
- Sorting
- Moulding
- Drying
- Firing
- Packaging
- Shipping
Your first pass for the steps doesn’t need to be detailed or complex. Your goal is to understand what you will write about. After you do this, you can get more detailed with the processes. You don’t want to start writing a complex piece if you don’t understand the process you are writing about. Breaking it down into smaller pieces is helpful for understanding the whole process.
You can more effectively write about each piece in detail if you separate it from the whole process before you start.
Conclusion
That was everything you need to know about the IELTS writing task 1. The main thing to remember is to read and understand the question fully before you start to write. A lot of useful information is contained in the question. You can find a brief summary of the data and an outline for your writing there.
Getting as much practice as possible with different types of graphs and diagrams will give you the experience you need to pass with a good band score.
If you need personalized coaching for the IELTS test, contact me by email and we can start creating the perfect IELTS lesson plan for you.
I also offer affordable writing coaching for writing task 1 and 2. Check it out here.